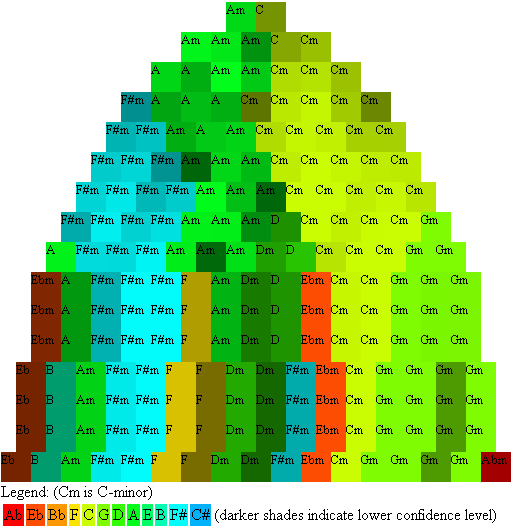
Figure 1: Correlation analysis with increasing window size
The composition "De Loodgieters" consists of 17 measures, represented by 17 squares in the bottom line of both figure 1 and 2. Time runs linearly from left to right in both figures and for the higher lines in figure 1 the position of a square still corresponds to its potition in time on the horizontal axes. In Figure 1 each square shows the key with the best correlation between the total duration of each present pitch and a predefined (fixed) key-profile. The sample width starts off with one measure for each square at the bottom line and slowly increases until, at the top line, one square almost covers the entire piece. The squares in figure 1 are drawn at the time of the centre of the sample. The analysis in figure 1 follows the algorithm of [1, 2].
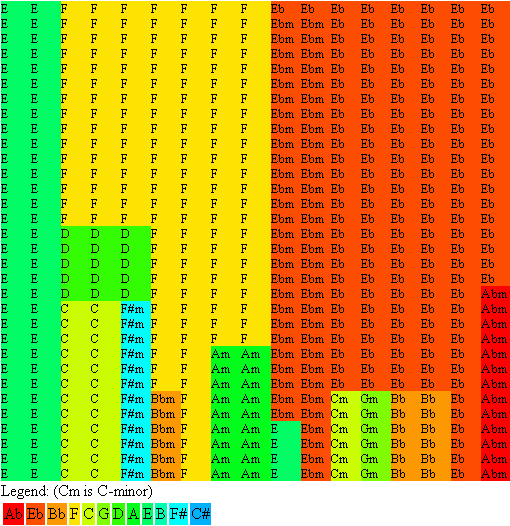
Figure 2 shows a Bayesian analysis of the same composition. The sample size now remains constant at one measure per square. In each measure only the occurrence of pitches is considered, irrespective of the duration or repetition of notes. For all pitches that occur (and for all pitches that do not occur) the chance of this occurring (and not occurring) is computed. This computation is based on predefined (fixed) pitch probability profiles. Next a certain penalty for key-changes is taken into account (key inertia) and all measures are combined in an exhaustive search for the optimal key distribution. In the bottom line of figure 2 the key penalty is zero and then increases in the higher lines, reducing the probability of key changes. The analysis in figure 2 follows the algorithm in [3, 4].
Both figures seem quite different at first sight. However, the music analysed is not meant to be in a certain key, so the whole concept of tonality and key is not very relevant. Still, a number of similarities can be observed. In the illustration below three lines from figure 1 and 2 are compared:
From the 17 measures both algorithms seem to agree on the key for 7 measures. (measure 5 is in F#-minor, measure 7 in F-major, measure 8 in A-minor, measure 11 in Eb-minor, measure 12 in C-minor, measure 13 in G-minor, and measure 17 in Ab-minor). This is quite remarkable, since the way in which the keys are computed is very different, and, there is no key meant to be present. In the particular style of music that we consider ("De Loodgieters") a lot of repeated notes occur. This tends to give far too much weight to these notes in the correlation analysis of figure 1. In the Bayesian anlysis a repeated note weighs as much as a single one. So this analysis should be better suited for our purpose. On the other hand, key stability is not really present in our music, so the concept of key-inertia in figure 2 has no real meaning. Thus, the higher lines of figure 2 should not be taken too seriously.
Summarizing, the higher lines of figure 1 are wrong because of the effect of repeated notes and the higher lines of figure 2 are equally wrong because of the forced but not present key-inertia. The lower lines, however, do have some significance.
More useful is the following agreement in both analyses: key changes (modulations) in "De Loodgieters" do not stay close to each other on the circle of fifths. This is illustrated by the particular coloring in the figures. The legend shows how the cirle of fifths is mapped onto the colors of the rainbow. A modulation from C to G would only change a hue of green. However, abrupt changes of color indicate that a modulation of the key takes place that jumps many fifths on the circle. Such modulations are often not easy to appreciate. In both figure 1 and figure 2 many contrasting changes of color appear, suggesting that the composition is far from pleasant to the ear. Compare this, for instance, with the same algorithms applied to the Allegro in Mozarts Piano Sonata in C Major, K.V.545, as shown in the two figures below:
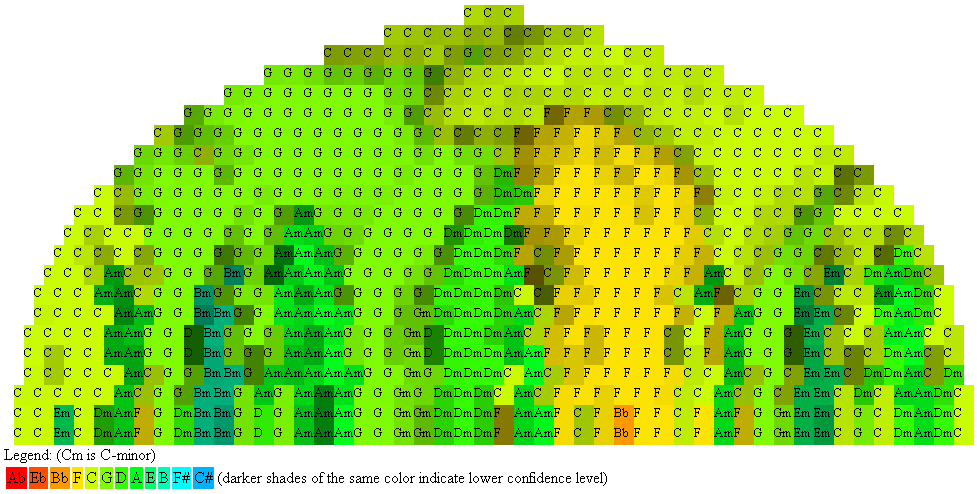
Figure 3: Correlation analysis with increasing window size of Mozart's piano sonata K.V. 545
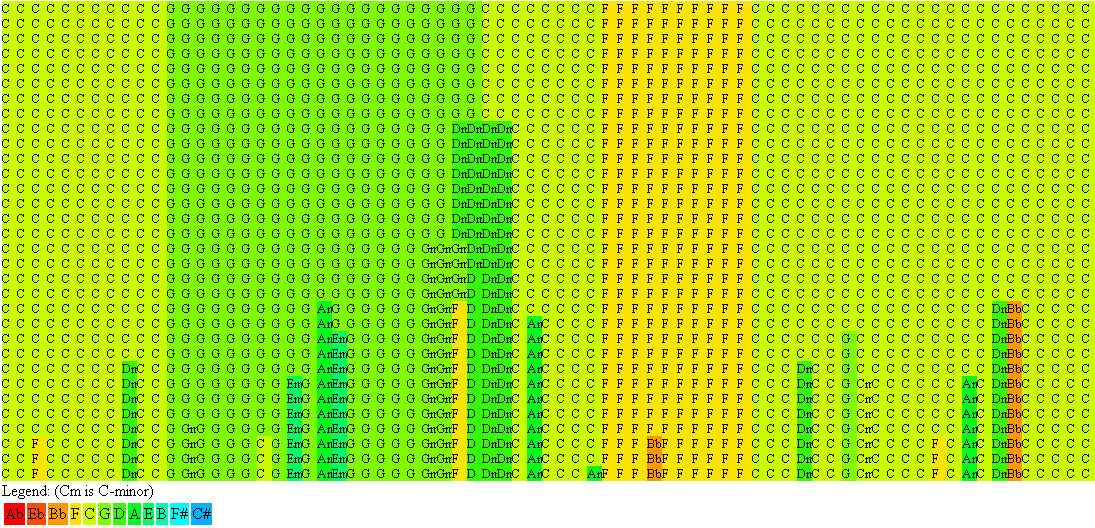
Figure 4: Bayesian analysis with increasing key-inertia of Mozart's piano sonata K.V. 545
The evident difference between K.V.545 and "De Loodgieters" is the gentle modulation in the former compared to edgy jumping in the latter. K.V.545 moves smoothly from hues of yellow to hues of green, whereas "De Loodgieters" jumps seeming randomly through all colors of the rainbow.
The other difference is that both analyses are in good agreement for K.V.545. The music runs in both figures from C-major through G and F and ends again in C-major. In the middle is a little area of D-minor. The agreement suggests that the same keys will be found by both algorithms when a clear tonality is present in the music. On the other hand, when there is no tonal content, both algorithms will probably disagree.